| Interesting Math History |
|
|
| Question : |
|
What is a 'Graph' ? |
Answer : |
|
A graph is the pictorial representation of Statistics. |
|
For Example,
|
|
If we want to show the comparative rainfall in a certain
district from month to month, we draw a graph depicting a row of vertical glass tubes, one for each month, each of them
shaded, to a depth which represents the number or inches of rainfall for that month.
|
|
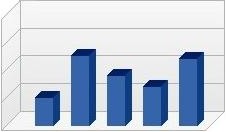
Bar Graph :
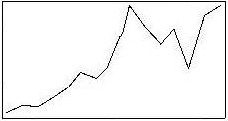
Line Graph :
|
|
|
Many other statistics can be reduced to simple graphs.
The paper written by Leonhard Euler on the Seven Bridges of Königsberg and published in 1736 is regarded as the first paper
in the history of graph theory.
|
|